The British Joint Services Command and Staff College defines the “fog of war” as “the uncertainty in situational awareness experienced by participants in military operations.” It’s a loose term used to describe the imperfect information commanders must deal with when sizing up their own forces, the strength of their enemy, adversarial intent and the direction of engagement.
Because of the complicated interactions and many smaller skirmishes that took place at the Battle of Gettysburg—Culp’s Hill, Pickett’s Charge, Little Round Top and Cemetery Hill, to name but a few—it can often be hard for history enthusiasts and students to visualize the battle.
Thanks to the Smithsonian and new technology provided by ESRI, that task has been made much easier.
[text_ad use_post=”2262″]
Get the Same View as the Gettysburg Commanders
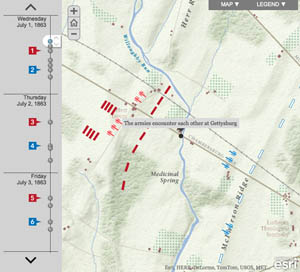
Anne Kelly Knowles, a professor of Geography at Middlebury College, has worked with a team that includes researcher Dan Miller and cartographer Alex Tait to create a fully interactive map, outlining the fighting that took place in those gruesome three days of battle.
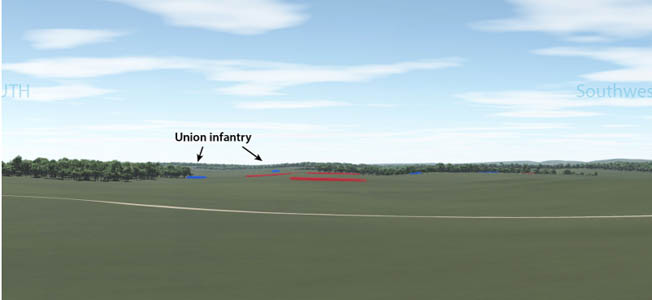
In addition to outlining the major battles, the team has also created panoramas from strategic viewpoints to let viewers see the same vantage points as the Gettysburg commanders.
To view the interactive map and see what conclusions the team has been able to draw from its data, visit the Smithsonian website.
Join The Conversation
Comments
View All Comments